Project Data Collection and Visualization using SharePoint, Excel Power Automate, and Power App
![]()
![]()
![]()
![]()
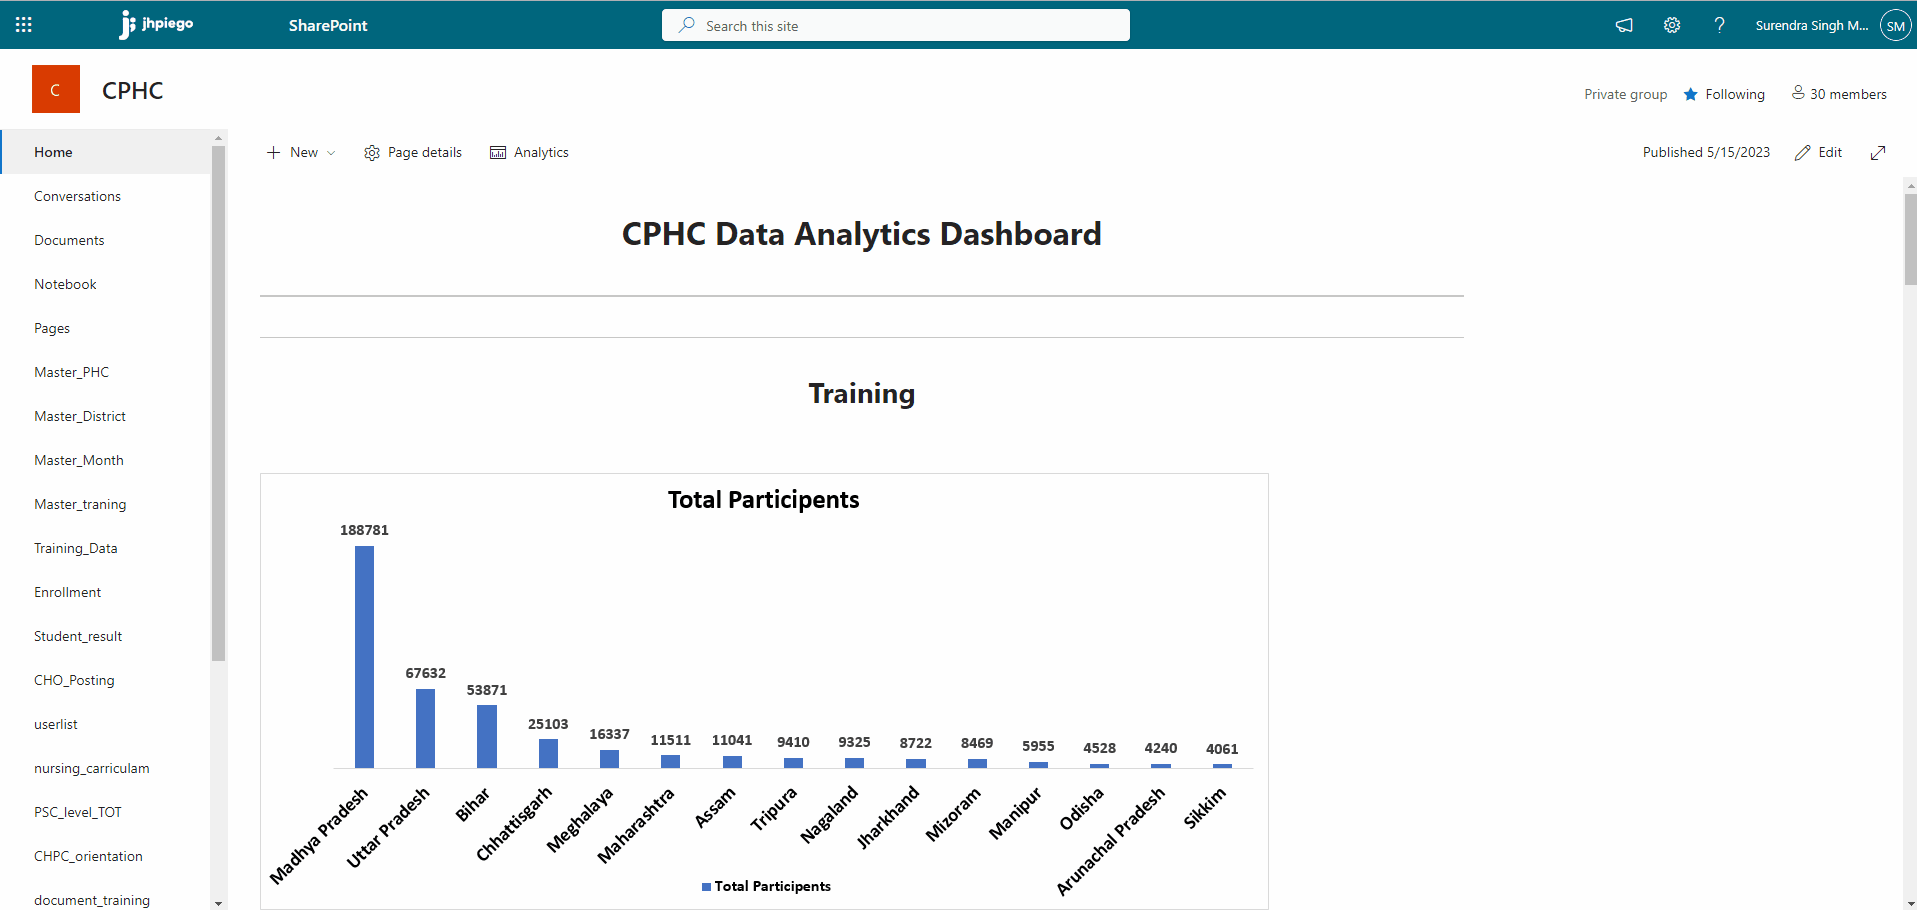
Developed an efficient Management Information System (MIS) for internal data reporting using Microsoft 365,
which includes Power App tools for data collection and SharePoint list for data storage. The system provides staff
with web-based tool or SharePoint app for mobile to collect data. Strict access control measures are in place, allowing me
to manage staff access. Utilized Excel to create graphs and added them to the SharePoint landing page,
(not using Power BI). The data automatically updates using Power Update, saving time and enhancing efficiency.
This system has streamlined internal data reporting, providing easy access to data and analysis tools.
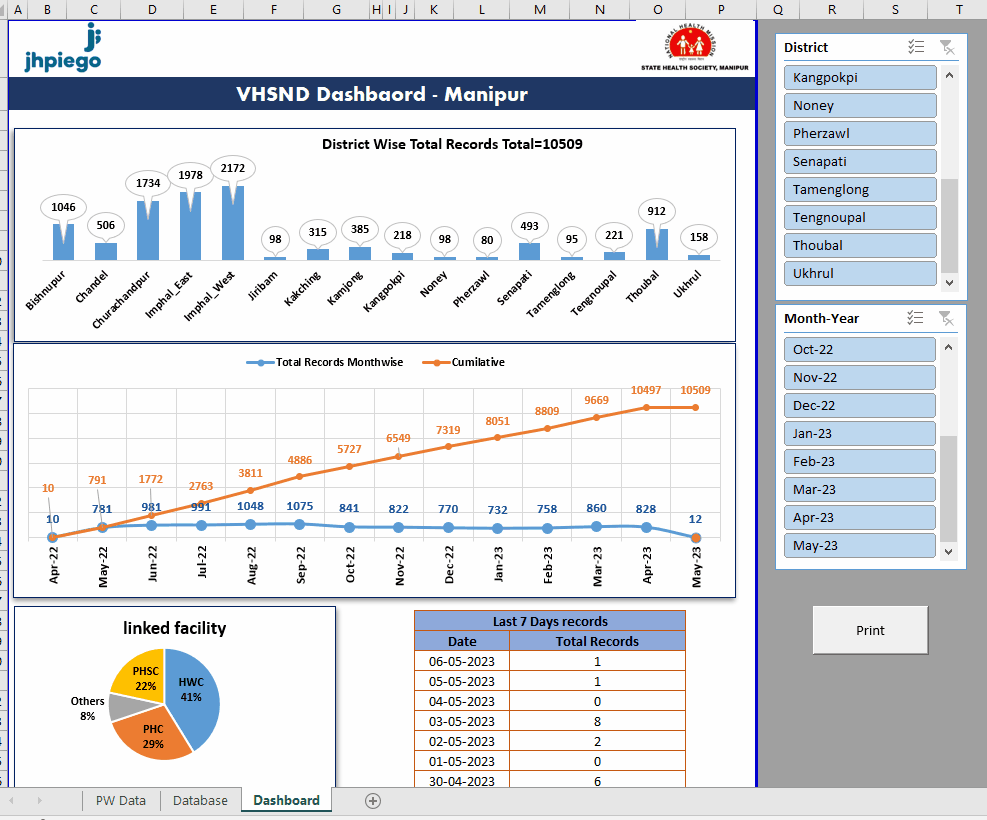
VHSND Dashboard developed for Manipur NHM using Excel and data connected with Kobo-toolbox
![]()
I created a checklist using Kobo Toolbox and rolled it out to collect data in the state now we need a dashboard for monitor the data.
Developed a dashboard using excel for Manipur NHM, I developed graphs and charts using formulas to create an interactive and dynamic dashboard.
This ensures that all data on the dashboard is automatically up-to-date.
To ensure that the dashboard is valuable for the NHM, I shared it with the state and welcomed their feedback.
Dynamic Dashboard Creation: Integrating Live DHIS2 Data and External Data Sources Using Python
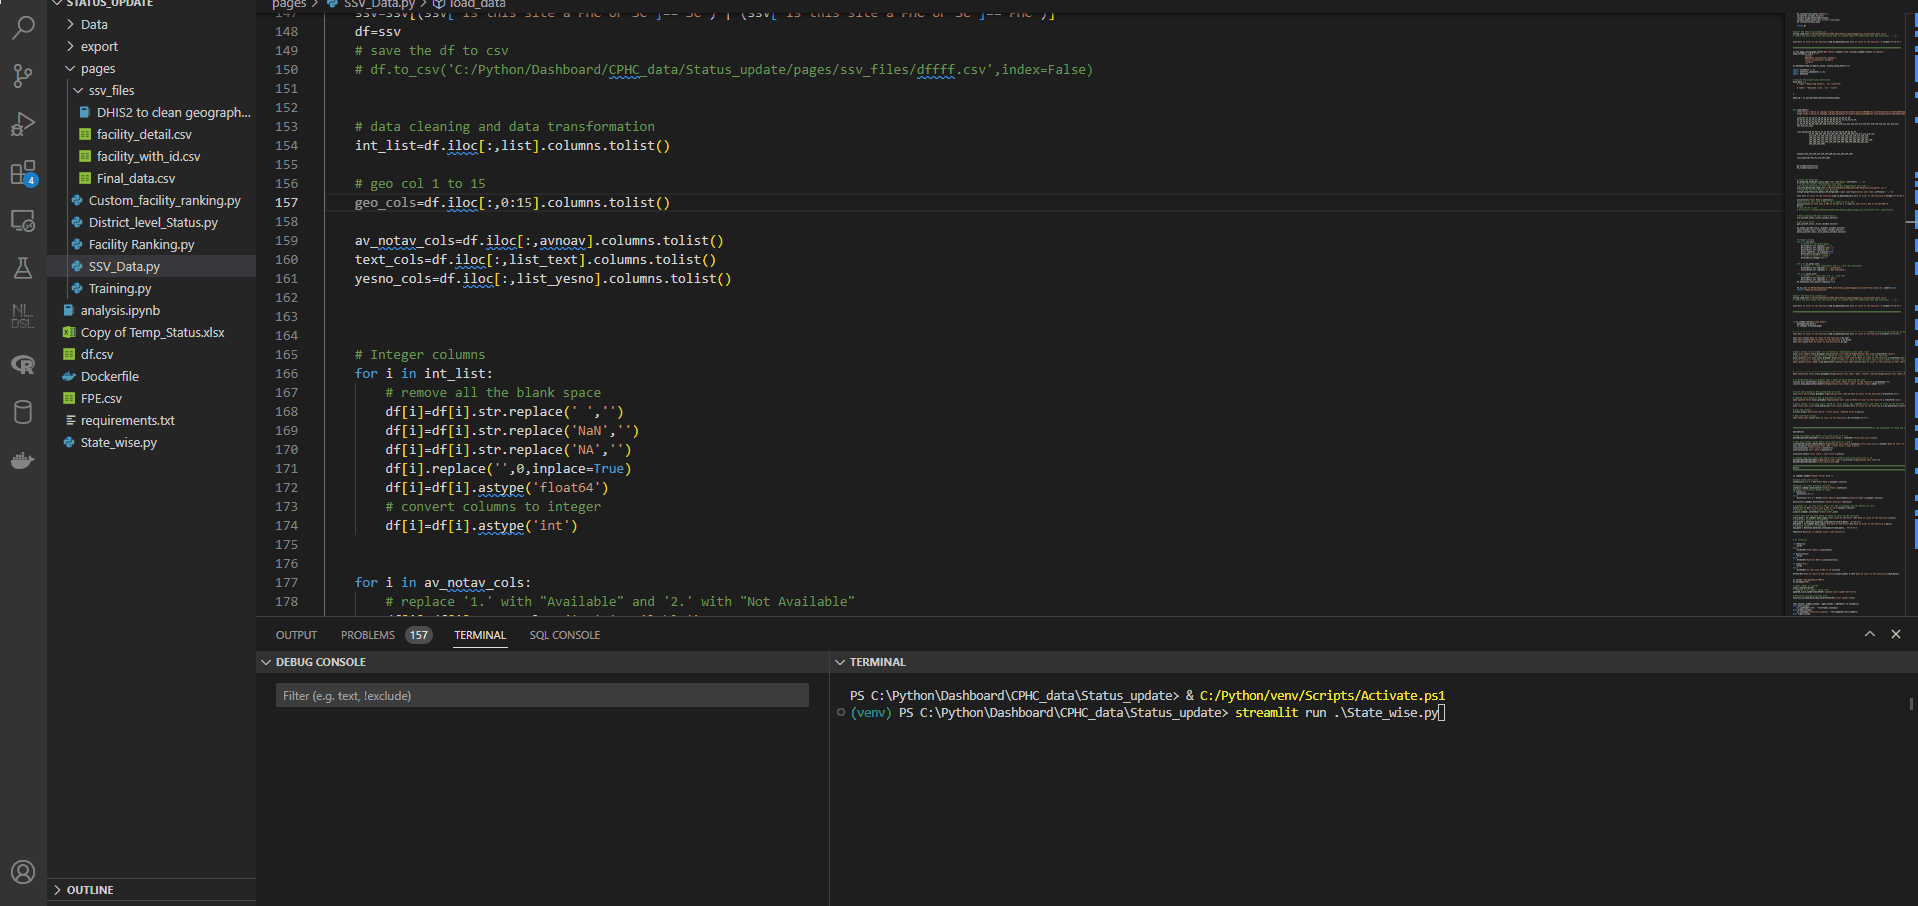
Created a dynamic dashboard using Python that connects with DHIS2 and incorporates live data. In DHIS2, the process of creating a customized dashboard to suit
specific needs can often be lengthy, particularly when it involves integrating data that is not collected within DHIS2 itself. For example, there may be indicators,
like SSV, that are not collected in DHIS2 but need to be included in the dashboard. To address this challenge, I developed a solution that connects live DHIS data (SSVData)
with additional data uploaded in CSV format. By leveraging Python, I was able to establish seamless connections between these data sources and generate an interactive and
insightful dashboard